Data Dogs meets every first Monday at Hawthorne Lucky Lab from 6pm-8pm.
Registration is not required but content for the monthly meetup is published here: https://www.meetup.com/Portland-Data-Science-Group/
Cycle 2 – Data Growth (2/6/17)
“Everything you know, everything you can think of, everything you encounter every moment of every day is information that has the potential to be captured, encoded, and therefore turned into data.” – http://blog.districtdatalabs.com/data-exploration-with-python-1
The first step in the data science pipeline is data collection but how can we collect data which comes in such a variety of forms? Marketing teams may construct a buyer persona from three forms of data: demographic, psychographic and application. Although a moment-in-time can be captured, each of these forms have their own elasticity. This persona data grew from annual longevity, life experience and application usage. Like the five blind men touching an elephant, each captured piece of data will be right but on the whole, it will be incomplete.
More on Observations, Variables and Types:
Well intended applications, computers and programming languages store data. Computers are great at quickly looking over observations(Rows) and variables(Columns). Many software systems were designed around databases with easy to create and modify tables enforcing specific types of data. Integers are stored separately from characters and so forth.
Similarly, people with good intentions need to insert rows into business data frames or add new variables as the business changes. Sometimes adding a single variable into a data frame will create the need for hundreds of entries.
Think about products and services sold in pricing tiers or categorical clusters. Single changes into how many tiers or what offerings may be made within a tier will create data growth.
product_name | tier_name | offer_number | price
Product 1|Tier 1|1|$5
Product 1|Tier 1|2|$10
Product 1|Tier 1|3|$15
Product 1|Tier 2|1|$50
Ian’s Philosophical Tidbits:
- Be as intentional as the situation allows while growing your data.
- Imagine being able to see digital exhaust. Wild bits moving like smoke don’t have 90° edges.
- Changes in metaphors lead to changes in approach. Approaching the body as a machine has different outcomes than approaching the body as a garden.
- Raw data is very hard to visualize. Trying to look at a set of numbers and visualize a plot is like trying to look at pen and visualize Captain Ahab.
Reading further on Data Growth:
1. Tidy Data (skim and understand the nomenclature)
2. Missing Data
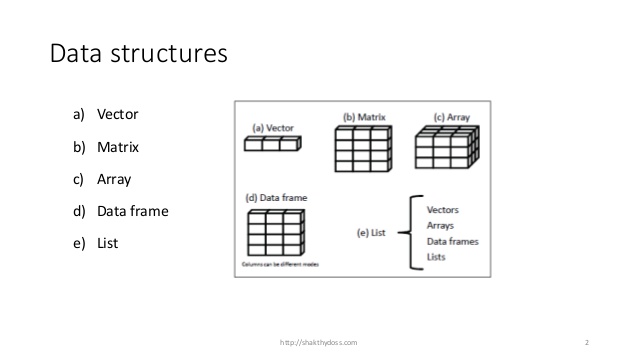
5. Data Wrangling (Data structures explained with Legos)