I want to talk about some new methods I’ve been applying in order to sustain the gains following a business process improvement project. Often this has been a challenge because monitoring and attention tend to shift after achieving improvements on a project. So what I’ve been doing is automating the monitoring of a given area so I can see changes at any point throughout the day or extended time duration.
Example: Credit Card Payment Errors

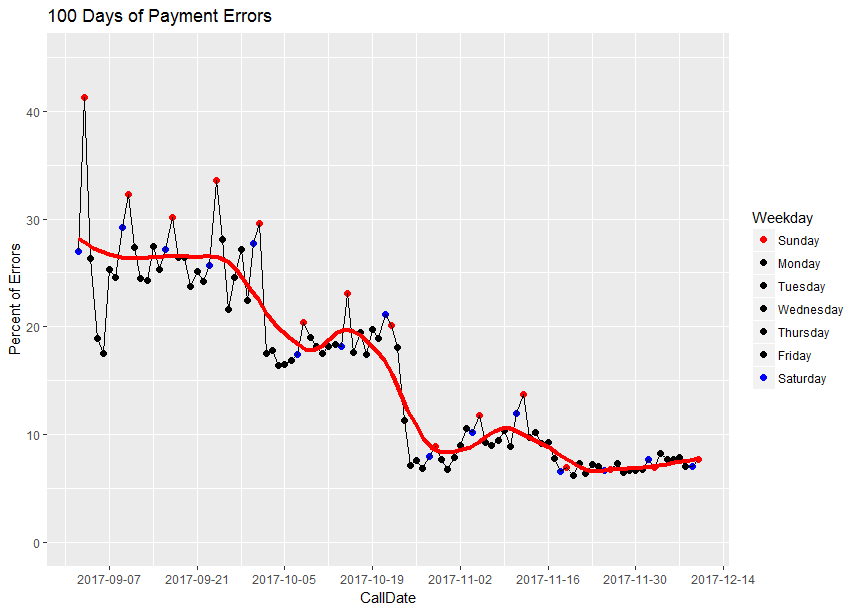
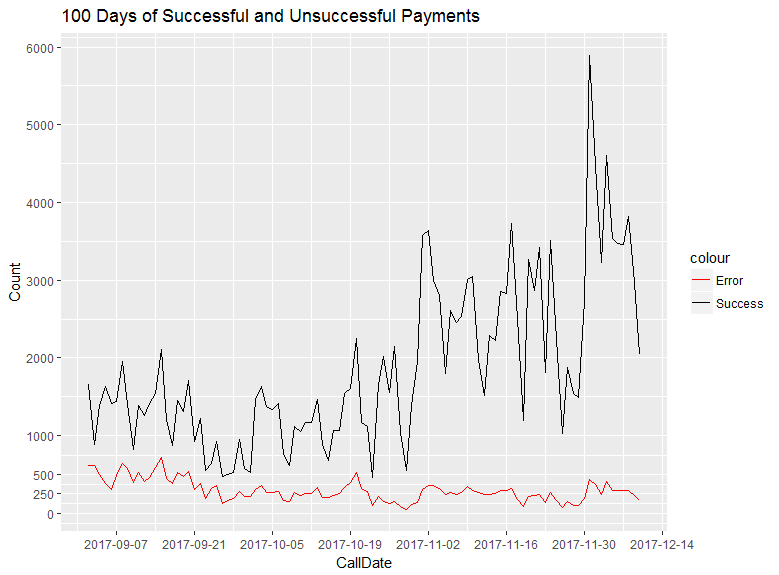
Problem: Errors during payment processing had increased over several months.
Root causes: The two decreases in errors were the results of infrastructure upgrades.
Now the problem morphs into a sustainability question: How do we know if our upgrades match our capacity? Well, the only way to determine that is through measurement. Typically what I would do would be to run some SQL, export to Excel, refresh data throughout the spreadsheet and view some resulting chart or summary integer. Total time about 5 minutes. Which isn’t a long amount of time but when I have to check the health of a system multiple times per day, those answers need to be much quicker so in order to reduce that time here is what I did along with what benefit it provided.
However what I did on this project was:
- Write results to a temporary SQL table.
- Program the ratio metrics right into my SQL SELECT clause.
- Query the results table directly from R.
- Write a few easy clean-up tasks.
- Automatically visualize results.
Time to run: 5 seconds!
